Archive | InBrief
Structured data exploration for analytics applications
Structured data exploration for analytics applications
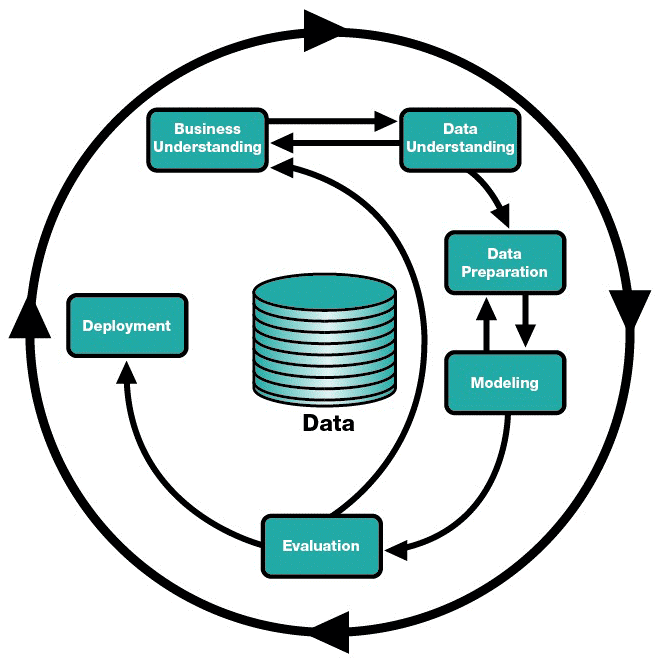
All organizations have to depend on raw data sources for insights into things like customer demographics, customer purchase behavior, transactional history, customer satisfaction, product attachment rates and inventory trends. A company’s ability to succeed is directly proportional to its ability to extract insights from the huge volumes of data at its disposal. The process of extracting insights from data (i.e any analytics application) starts with business understanding and data exploration. Data exploration refers to the process of identifying the right data, gauging its usefulness in relevance to the analytics problem, managing anomalies and making it “ready” for the predictive applications. Figure 1 below shows the cross industry standard process for data mining or CRISP-DM, which is a widely used framework to tackle analytics problems. Data exploration is the combination of data understanding and data preparation phases.
Most analytics professionals or data scientists would agree that this data exploration phase accounts for almost 50-75% of the overall effort. According to a recent CrowdFlower survey "60% of the data scientists surveyed said cleaning and organizing data is among their most time-consuming tasks. " In some respects, all data sources and related problems are unique in nature. It is impossible to have a “one-size-fits-all” approach to solve the data exploration problem. Hence, instead of focusing on a magic solution, our analytics team relies on a framework to guide clients through this phase. This framework is a series of steps and data exploration techniques that we follow during this phase. In our experience we have found that this structure really helps us in being consistently useful and accelerate through this phase. This framework can be viewed as a guide, an enabler, an attempt to standardize the most time consuming task faced by every data scientist.
Step 1: Determine the “right” data to explore
The universe of data has changed vastly in recent years. Organizations already have the data they need to tackle problems. The problem has shifted from lack of data to identifying the right data to solve the problem. No one really wants to waste time cleaning data which eventually will not be used or be relevant to the analytics problem at hand. We kick of all projects with this step through a brainstorming session with our clients to identify relevant data elements. Creativity with respect to the potential external and new sources of data like social media is critical in this phase.
Step 2: Identify expectations of the data
Data has value only when confronted with a useful theory. Attributing importance to data before hypothesis means that we are actually ignoring the actual thinking and as a result we might end up with trivial or arbitrary conclusions or patterns emerging by chance. The best technique for beginning data exploration is to generate a hypothesis to be proven correct or incorrect. Hypothesis generation means making an educated guess on what to expect from the data or what distribution can we expect from the data. It is not imperative that the hypothesis be always right. An invalidated hypothesis simply means that we improved our understanding about the problem.
Step 3: Determine the degree to which the data is complete and unique
Before proving or disproving a hypothesis, it is important to understand the completeness of the data. When exploring a sample of data, we conduct tests to ensure that the sample is representative of the population. We then check if the data is well populated. Here we basically look at high level descriptive statistics of all variables which includes number of populated values, number of missing values, and number of distinct values. We identify the missing data and treat them prior to applying any algorithms. Treatment of missing values can vary from deletion, imputation (mean/mode/median) to algorithmic (K-th nearest neighbors) and the selection of technique really depends on the data and business context. If we have very few missing values then deletion of records can make sense, if the number is high then we use either imputation or algorithmic techniques. We then eliminate redundancies in the dataset by eliminating perfectly/highly correlated variables or variables which can be expressed as transformation or combination of other variables.
Step 4: Determine the accuracy of the data being explored
In this step we visualize the data through histograms, boxplots, trend charts and scatter plots to prove or disprove the hypothesis. It can also help us to identify true outliers in data. It is important to understand the “story” behind the data while diagnosing if it is a true outlier. If the outliers are due to data entry/processing error then we use techniques like capping, imputation or deletion based on the number of outliers in the data. If the outliers are something we should be expecting in the data and of significant importance then we either try transformations to reduce the impact of the outliers or analyze them separately.
Step 5: Identify the underlying patterns/trends in the data
In this step we explore the relationships between variables (i.e. bivariate analysis). Here we look at variables from different lenses, for example looking at sales through customer attributes, geographical location, product attributes, e-commerce vs retail and so on. Data exploration techniques used during this step can vary from basic things like pivoting the data to statistical functions like correlation, variable clustering and so on. More often than not this step results in introducing new variables into the dataset. For example if sales spikes during holidays, we introduce a dummy variable to explain the spike.
This structure for data exploration has helped us help our clients by eliminating the concepts of trial and error, reducing back and forth, improving communication with our clients and increasing reliability of the analytical initiatives. With the help of this structure we were able to improve the turnaround time of all our analytics engagements by at least 25%.


